
Dead Letter Queue
The Dead Letter Queue (DLQ) explorer is one of CritterWatch's most powerful operational tools. It provides a unified view of failed messages across all services and their durability databases, with the ability to replay, discard, or edit-and-replay individual messages or batches.
CritterWatch manages the durable (database) DLQ only
The explorer reads from each service's Wolverine durability database — not from broker-native dead-letter queues. Messages that dead-letter natively at the broker (Amazon SQS DLQ, Azure Service Bus $DeadLetterQueue, RabbitMQ DLX) won't appear here until they're forwarded into the Wolverine database. If your services use native DLQs, see Native DLQs and CritterWatch management for how to bridge them.
Querying Dead Letters
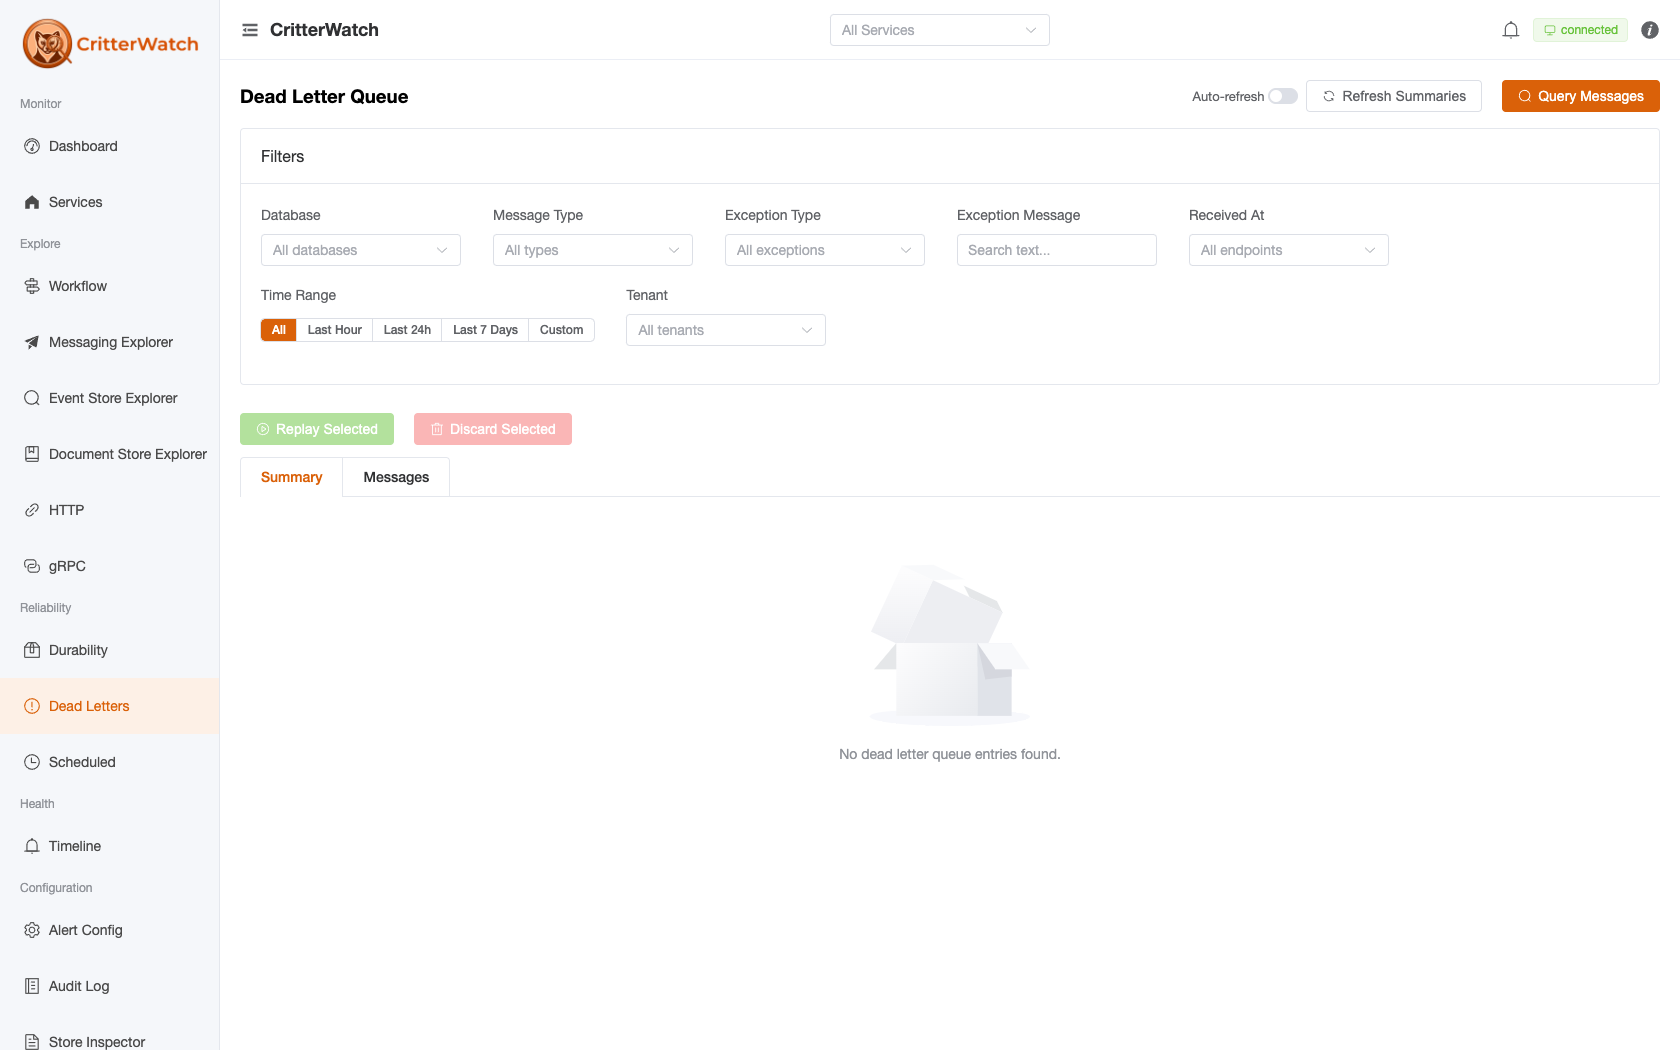
A banner at the top tracks the fleet-wide total ("6,383 total dead letter(s) across all services") with a DLQ Trend sparkline, and a chip shows when the page is scoped to the header's selected service. The Filters card narrows everything below it:
| Filter | Description |
|---|---|
| Database | Scope to one durability database (multi-store / multi-tenant services expose several) |
| Message Type | Filter by the .NET type name of the message |
| Exception Type | Filter by the exception class that caused the failure |
| Exception Message | Free-text match against the exception message |
| Received At | Scope to the endpoint the message was received on |
| Time Range | All · Last Hour · Last 24h · Last 7 Days · Custom |
| Tenant | Scope to a specific tenant (for multi-tenant services) |
(Service scope comes from the global service selector in the header.)
Results render in two tabs: Summary — grouped counts per service / database / message type / exception type, loaded automatically — and Messages — individual envelopes, loaded on demand: click a summary row or press Query Messages in the toolbar. A Group by exception toggle collapses the message list by exception type. Auto-refresh and Refresh Summaries controls sit in the toolbar.
Result Table
Each row in the results shows:
| Column | Description |
|---|---|
| Message Type | The .NET type name of the failed message |
| Exception Type | The exception class that caused failure |
| Attempts | How many times Wolverine attempted processing |
| Dead-Lettered At | Timestamp when the message was moved to DLQ |
| Message ID | The Wolverine envelope GUID |
Click any row to open the Message Detail panel.
Message Detail
The detail panel shows the full envelope:
- Message body — formatted JSON of the message payload
- Exception message — the last exception thrown by handlers
- Full stack trace — expandable view of the exception stack
- Envelope headers — correlation ID, causation ID, source address, scheduled time
- Processing history — timeline of each delivery attempt
Actions
From the detail panel, you can:
Replay — send the message back through the original processing pipeline without modification. The message is removed from the DLQ and re-enqueued for delivery.
Edit and Replay — opens a JSON editor pre-populated with the message body. Modify the payload (correcting data errors, fixing missing fields, etc.) and click Replay to send the modified version. The original dead-lettered message is discarded.
Discard — permanently delete the message from the DLQ. This is irreversible and requires confirmation.
Edit and Replay Use Cases
Edit-and-replay is most useful when a message failed due to data issues rather than code bugs:
- A required field was null that has since been populated
- A numeric value exceeded a validation range that has been corrected
- An external ID changed between when the message was sent and when it was processed
Batch Operations
Four bulk actions sit above the result tabs:
Replay All Matching / Discard All Matching — apply to every message matching the current filters, whether or not it is loaded into the Messages tab. Discard requires confirmation; it is irreversible.
Replay Selected / Discard Selected — apply to the rows ticked in the Messages tab (enabled once at least one row is selected).
Summary rows also carry per-group Replay All / Discard All actions, so a whole exception or message-type bucket can be replayed without loading its envelopes.
Exception Grouping
The Group by exception toggle collapses the Messages list into a summary by exception type — exception class, count, most recent occurrence — for spotting whether a DLQ spike stems from a single root cause (e.g., a downstream outage or a schema migration issue).
Multi-Tenant DLQ
For multi-tenant services, the Tenant filter scopes the query to a specific tenant's message store. Each tenant has an independent DLQ; messages from one tenant do not appear in another tenant's results.
Replay and discard operations target the specific tenant's database, ensuring data isolation between tenants.