Activity Timeline & Audit Log
The Activity Timeline is a real-time chronological feed of every notable event across all monitored services. It serves as both an operational timeline — showing what is happening right now — and an audit log — recording what happened in the past, including all operator actions.
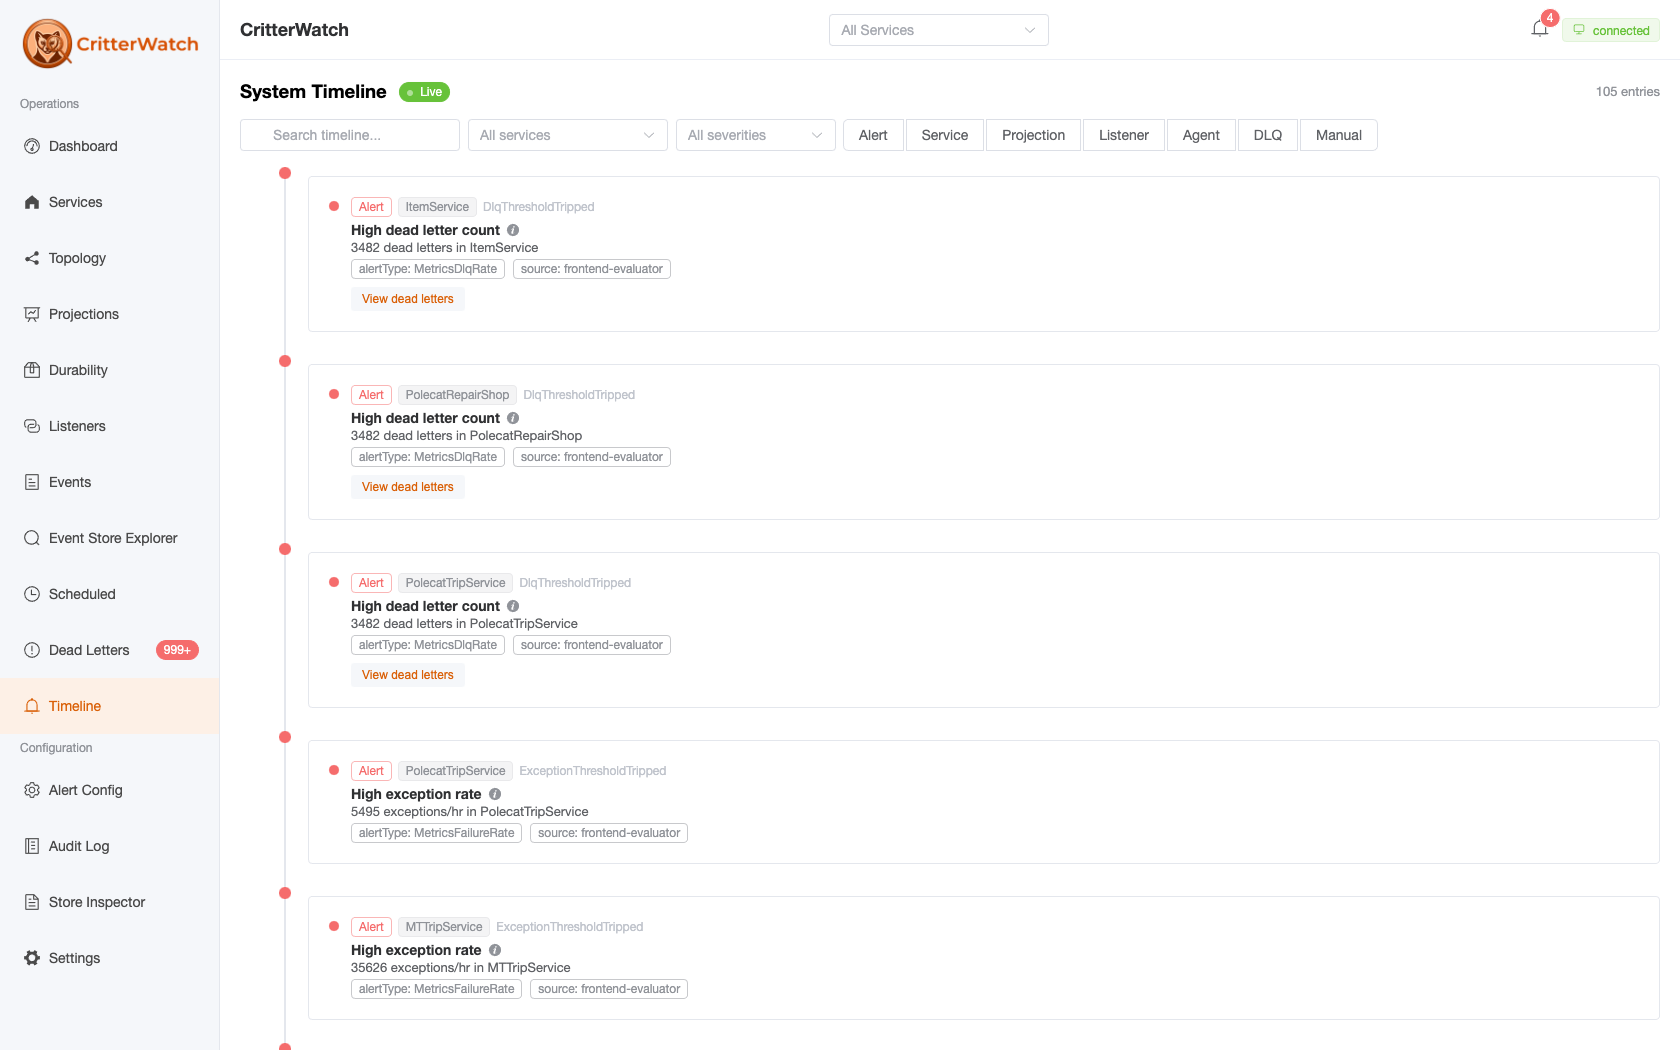
Timeline Feed
The timeline shows entries in reverse-chronological order (newest first). Each entry shows:
- Timestamp — when the event occurred
- Service — which monitored service the event came from
- Category — the type of event (see categories below)
- Severity — Info, Warning, or Critical
- Description — human-readable summary of what happened
New entries stream in via SignalR in real time. The feed automatically scrolls to new entries unless you have scrolled up to review historical items.
Event Categories
Service Events
- Service registered (first time seen)
- Service version updated
- Service went silent / reconnected
Node Events
- Node added (new process instance started)
- Node removed (process stopped cleanly)
- Leadership assumed (new leader elected)
- Stale node ejected (operator action)
Agent Events
- Agent started on a node
- Agent stopped
- Agent assignments revised
- Agent health degraded / recovered
Projection Events
- Shard states updated
- Subscription restarted (automatic recovery)
- Projection paused / restarted / rebuilt / rewound (operator actions)
Endpoint Events
- Endpoint added (new listener discovered)
- Circuit breaker tripped / reset
- Back pressure triggered / lifted
- Endpoint paused / restarted (operator actions)
Alert Events
- Alert raised / elevated / reduced / resolved / cleared
- Alert acknowledged / snoozed
Tenant Events
- Tenant added / disabled / enabled / removed
Operator Actions
All actions taken through the CritterWatch UI are recorded:
- DLQ replay / discard operations (with count)
- Scheduled message edits / cancellations
- Node eject / election trigger commands
- Endpoint configuration changes
Filtering
Filter the timeline by:
- Service — show only events from a specific service
- Category — show only specific event categories
- Severity — Info, Warning, Critical, or All
- Text search — filter by description content
- Time range — look back to a specific period
Audit Log
The Audit Log is a view into the subset of timeline entries that represent operator actions. It answers the question: "Who did what, and when?"
Each audit log entry shows:
- Timestamp
- Action — what was done (e.g., "Replayed 12 dead letters of type BookTrip")
- Service — affected service
- Actor — who performed the action (based on authenticated user, if authentication is configured)
- Note — optional note attached when clearing alerts or performing sensitive operations
The audit log can be exported as CSV for compliance or incident review purposes.
Pagination
The timeline displays the most recent 500 entries by default. Use the date picker to navigate to historical periods. CritterWatch retains timeline data for as long as events remain in the Marten event store (indefinite by default).