
Alert Configuration
The Alert Configuration page (/alerts/config) is where you tune what counts as a problem. CritterWatch ships sensible defaults, but every system has its own definition of "slow" and "behind" — this page is the single point where you change them.
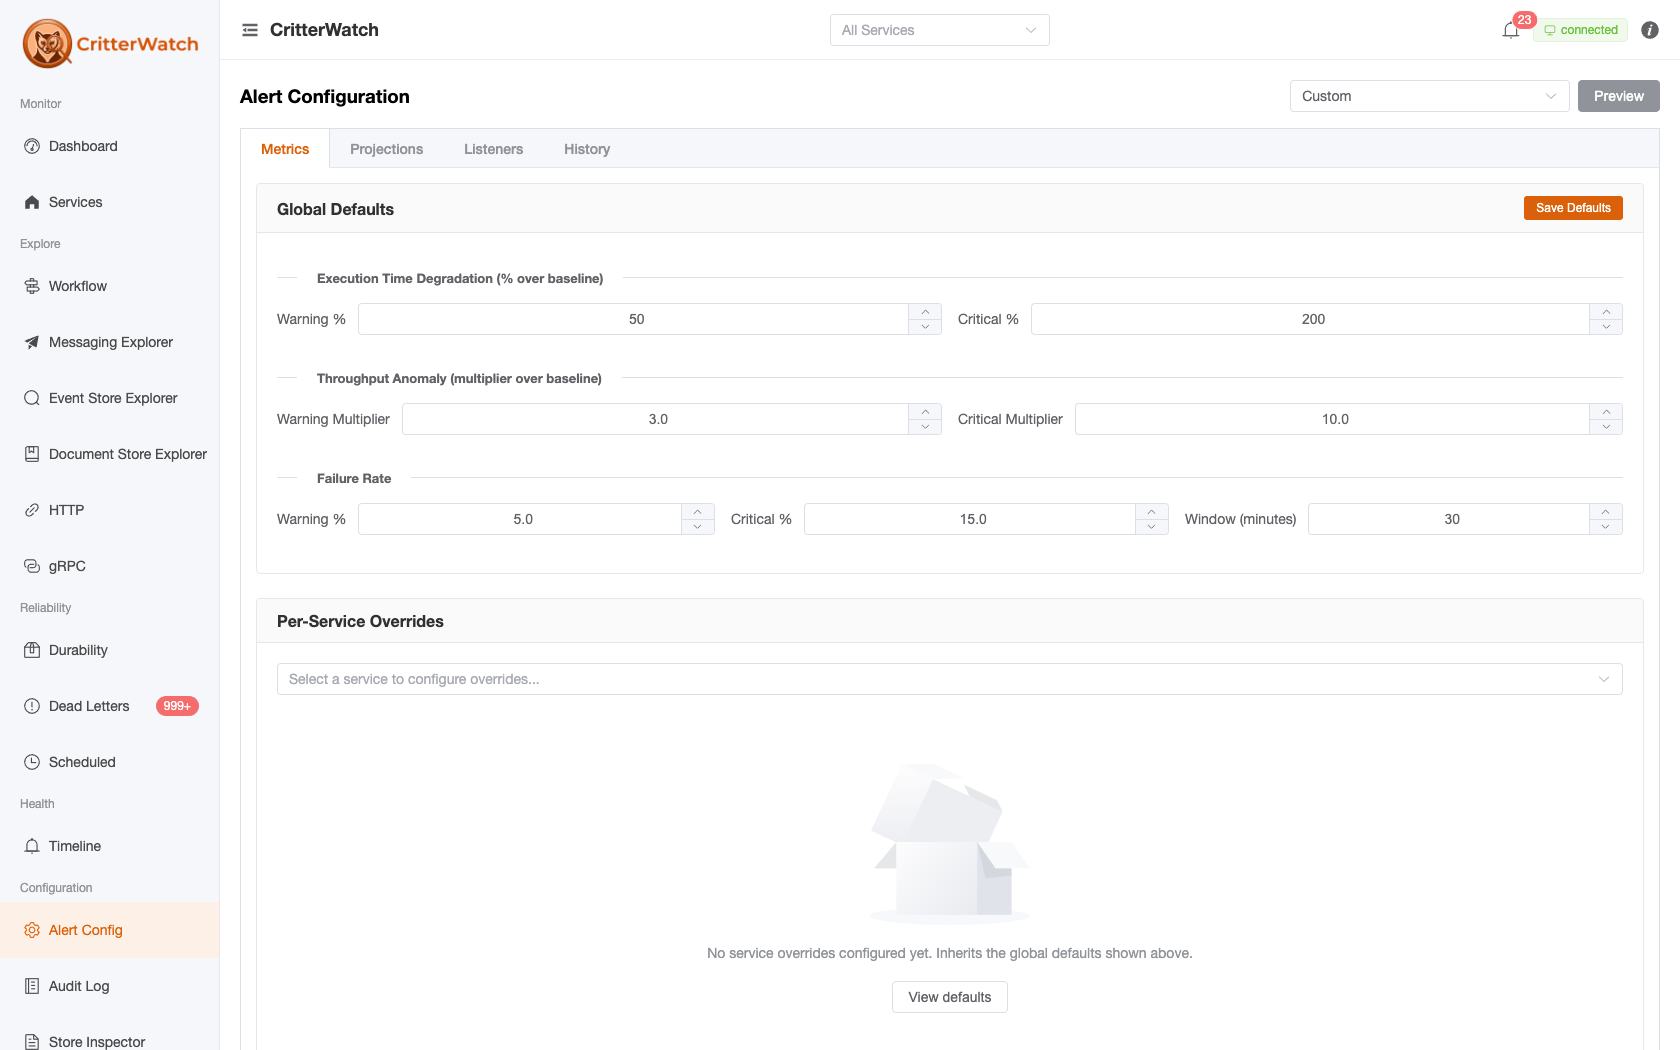
The page has four top-level tabs:
Metrics · Projections · Listeners · HistoryThe first three configure what raises alerts (and what auto-remediates); the last audits what changed, when, and by whom. A preset-profile dropdown in the toolbar (Custom when you've diverged) applies the Production / Development profiles described under Preset profiles.
Live Preview
The Preview control in the toolbar evaluates the current thresholds against the most-recent metrics buckets. As you edit the thresholds the preview updates so you can see what would fire right now if you hit Save. Useful for tuning a Critical threshold without burning a real alert.
| Preview column | Meaning |
|---|---|
| Severity | Warning / Critical that would fire |
| Service | Which service is over the limit |
| Message Type / Shard | The specific dimension at fault |
| Current Value | What the live metric reads |
| Threshold | What the configured threshold says |
The preview is read-only — saves only happen when you click an explicit Save button on the section that owns the change.
Metrics Tab
Metrics-side alerts fire on three dimensions: execution-time degradation, throughput anomalies, and failure rate. Each dimension has a global default plus optional per-service and per-message-type overrides.
Global Defaults
| Section | Threshold |
|---|---|
| Execution Time Degradation | Warning % over baseline · Critical % over baseline |
| Throughput Anomaly | Warning multiplier over baseline · Critical multiplier over baseline |
| Failure Rate | Warning % · Critical % · Window minutes |
The execution-time and throughput thresholds are relative — they fire when current metrics exceed a baseline by N percent / N times. The baseline is resolved through a cascade, in this order:
- Observed history, if it is mature enough. CritterWatch prefers what the service has actually been doing. "Mature" means at least
BaselineMinimumSamplessamples (default 100) and at leastBaselineMinimumDaysdays of history (default 10), aboveBaselineMinimumThroughputPerHour(default 1.0). All three are tunable per service. - A declared baseline, if history is not yet mature. Declare these with the
configureBaselinescallback onAddCritterWatchMonitoringin the monitored service. - No alert at all, if neither is available. A dimension with no baseline simply doesn't fire.
Observed history winning over a declaration is deliberate: a baseline someone typed a year ago is worse evidence than what the service did last week.
The failure-rate threshold is absolute — it fires when the failure percentage in the rolling window exceeds the configured percentage. The window controls how long an outage has to last before it crosses the threshold; small values are noisy, large values lag.
Per-Service Overrides
Pick a service from the dropdown to configure overrides just for that service. Each form field shows an "Inherited (X)" tag when it falls back to the default and an "Overridden" tag when an override is set. Empty / null fields inherit; non-empty fields override.
A service-level override also picks the metrics data source for that service:
| Source | Meaning |
|---|---|
WolverineRuntime | Default — pull live metrics from the in-process Wolverine OTel meter |
Prometheus | Scrape the configured Prometheus endpoint |
VictoriaMetrics | Scrape the configured VictoriaMetrics endpoint |
When Prometheus / VictoriaMetrics is chosen, an endpoint URL field appears.
Per-Message-Type Thresholds
The bottom of the Metrics tab takes a free-text "Add message type" input and lets you set per-message-type overrides on top of any service-level overrides. Same field shape as Per-Service Overrides; same inheritance tagging.
Useful pattern: for a slow-by-design batch handler, set its execution-time Warning % well above the service default so it doesn't drown the on-call queue in noise.
Projections Tab
Projection alerts fire on two dimensions: how far behind the high-water-mark a projection is, and how long since it last advanced (stale detection). A third toggle controls auto-restart on stale.
Global Defaults
| Section | Threshold |
|---|---|
| Behind High Water Mark (events) | Warning · Critical |
| Stale Detection (seconds) | Warning · Critical |
| Auto-Restart | On / Off |
"Behind" is the difference between the projection's current sequence and the event store's current high-water mark. "Stale" is the wall-clock interval since the projection last advanced.
Auto-restart, when enabled, sends RestartProjection to the affected service when a projection trips the Critical stale threshold. It will only restart once per stale episode — repeated stalls require operator attention.
Per-Service Overrides
Same pattern as the Metrics tab — pick a service, set overrides, see Inherited / Overridden tags.
Per-Shard Overrides
The most granular knob. Enter ServiceName:ShardName (e.g. OrderService:OrderProjection:All) to override thresholds and auto-restart for one shard.
Per-shard configuration also has a suppress switch that silences alerts entirely for that shard — useful for the rebuild scenario where a shard is intentionally far behind for the duration of a rewind, or for a known-broken shard that's being investigated.
Suppressing resolves the standing alerts too
Suppressing a projection resolves its existing alerts with "Alerts are suppressed for this projection" rather than freezing them active. Before 1.1 the resolve path sat inside the branch suppression skipped, so pressing suppress silenced every future alert and permanently froze the present ones — a suppressed projection that later caught up completely still read critical, describing a condition that no longer existed (GH-1232).
Per-tenant alerting
On a tenant-partitioned store a single projection is a per-tenant signal repeated thousands of times, so per-tenant alerting is governed by a ceiling rather than by thresholds.
The ceiling. PerTenantAlertCeiling (default 25) is the most individual per-tenant alert streams a projection may have. Above it, every per-tenant signal collapses into one roll-up alert per projection. The cap is not tuning for its own sake: at a real deployment's 2,173 tenants, un-capping would mean roughly 13,000 alert documents per evaluation cycle. A non-positive value means unlimited, matching PerTenantSampleCeiling beside it in the settings payload.
A roll-up carries its tenants as data. The roll-up's AlertMembership lists every affected tenant with Affected and InScope counts, so a complete answer stays distinguishable from a truncated one, and each member's FirstSeenAt is that tenant's own "since", carried forward across cycles. The message text keeps its five-name summary — the two are for different readers, and growing the prose to 1,299 names is not the fix. Before this, tenant identities survived only as five ids inside a sentence, so a large deployment could not route a per-tenant notification at all.
A watch list keeps named tenants individual. WatchedTenants on the per-service projection overrides names tenants that keep their own alert stream above the ceiling — "the dozen largest organisations", whose lag is a different kind of problem. A watch list spends from the ceiling's own budget rather than adding a second number, so there is one knob to reason about instead of two that can disagree. Overflow is reported on the roll-up, never silently honoured in part.
Suppression is the smaller lever. SuppressedTenants on the per-shard overrides silences one tenant of one projection — the lever to reach for when a single customer is mid-migration, instead of suppressing the projection and going blind to all 2,173 tenants at once.
Two rules worth knowing before you use both lists
Suppression beats watching. The lists are written at different grains — watch per service, suppression per projection — so a tenant landing in both is a matter of time rather than a mistake. "Be quiet about this one" is the more specific instruction.
A suppressed tenant leaves every roll-up, and the denominator with it. Not just the lag roll-up — hearing about a silenced tenant through the unmeasurable-or-unassigned summary would be a change of alert type, not suppression. It leaves the count too, because those roll-ups escalate to Critical when every eligible tenant is affected, and a silenced tenant left in the denominator would soften that verdict on the strength of a tenant nobody is watching. (A watched tenant leaves only the lag roll-up — that is the only one it has its own copy of.)
Listeners Tab
One concern: stuck-listener remediation. When a listener trips the stuck-listener alert — it reads Accepting but its transport channel is Disconnected or its receive loop has Faulted — CritterWatch can automatically send a Restart to try to recover it. The restart is rate-limited per endpoint (at most once every 10 minutes) so a genuinely-broken listener isn't hammered. Off by default; the Auto-restart stuck listeners toggle + Save Defaults turn it on. See Endpoints for how the underlying health pills surface.
History Tab
A read-only audit trail of every threshold change.
| Column | Meaning |
|---|---|
| Time | When the change was saved |
| Config Area | Which section was edited (e.g. MetricsDefaults, ProjectionService:OrderService) |
| Field | Specific field name |
| Previous | Old value (red) |
| New | New value (green) |
Use this to answer "who lowered the failure-rate Critical threshold last week?" and "did the projection-stale defaults change since the last quiet weekend?" The Refresh button re-fetches; the table is not auto-refreshed because edits are infrequent.
History is independent from the system-wide Audit Log — it tracks configuration changes specifically, not operator actions on services.
Hysteresis and Alert Lifecycle
CritterWatch alerts are event-sourced: they go through Raised → Elevated → Reduced → Resolved → Cleared. The Critical / Warning thresholds drive Raise and Elevate transitions; Resolved fires when the metric drops back below Warning; Cleared is operator-initiated.
Hysteresis prevents flapping at the boundary — once an alert is Raised, the metric must drop noticeably below the trigger before it Resolves. The hysteresis margin is built into the alert engine and is not currently surfaced as a user-tunable; this section will gain a control when the engine exposes it.
Tips
- Tune the preview, save once. The preview is the right place to iterate. Saving each tweak fills the History tab with low-signal entries.
- Per-service overrides win over global defaults. Per-message-type overrides win over per-service. Per-shard wins over per-service. There's no per-tenant layer today.
- A blank field is "inherit," not "zero." Setting a threshold to 0 means zero is the trigger. To remove an override entirely, clear the field — the inherited-tag should reappear.
- Use baselines, not absolute numbers. Absolute thresholds drift as load patterns change; baseline-relative thresholds adapt.