
Event Modeling
The Event Model is one of the two view modes on the Workflow screen. It draws your system in canonical Event Modeling notation — vertical slices across four horizontal lanes — and, unlike every other diagram in CritterWatch, it is assembled from more than one source and can tell you where those sources disagree.
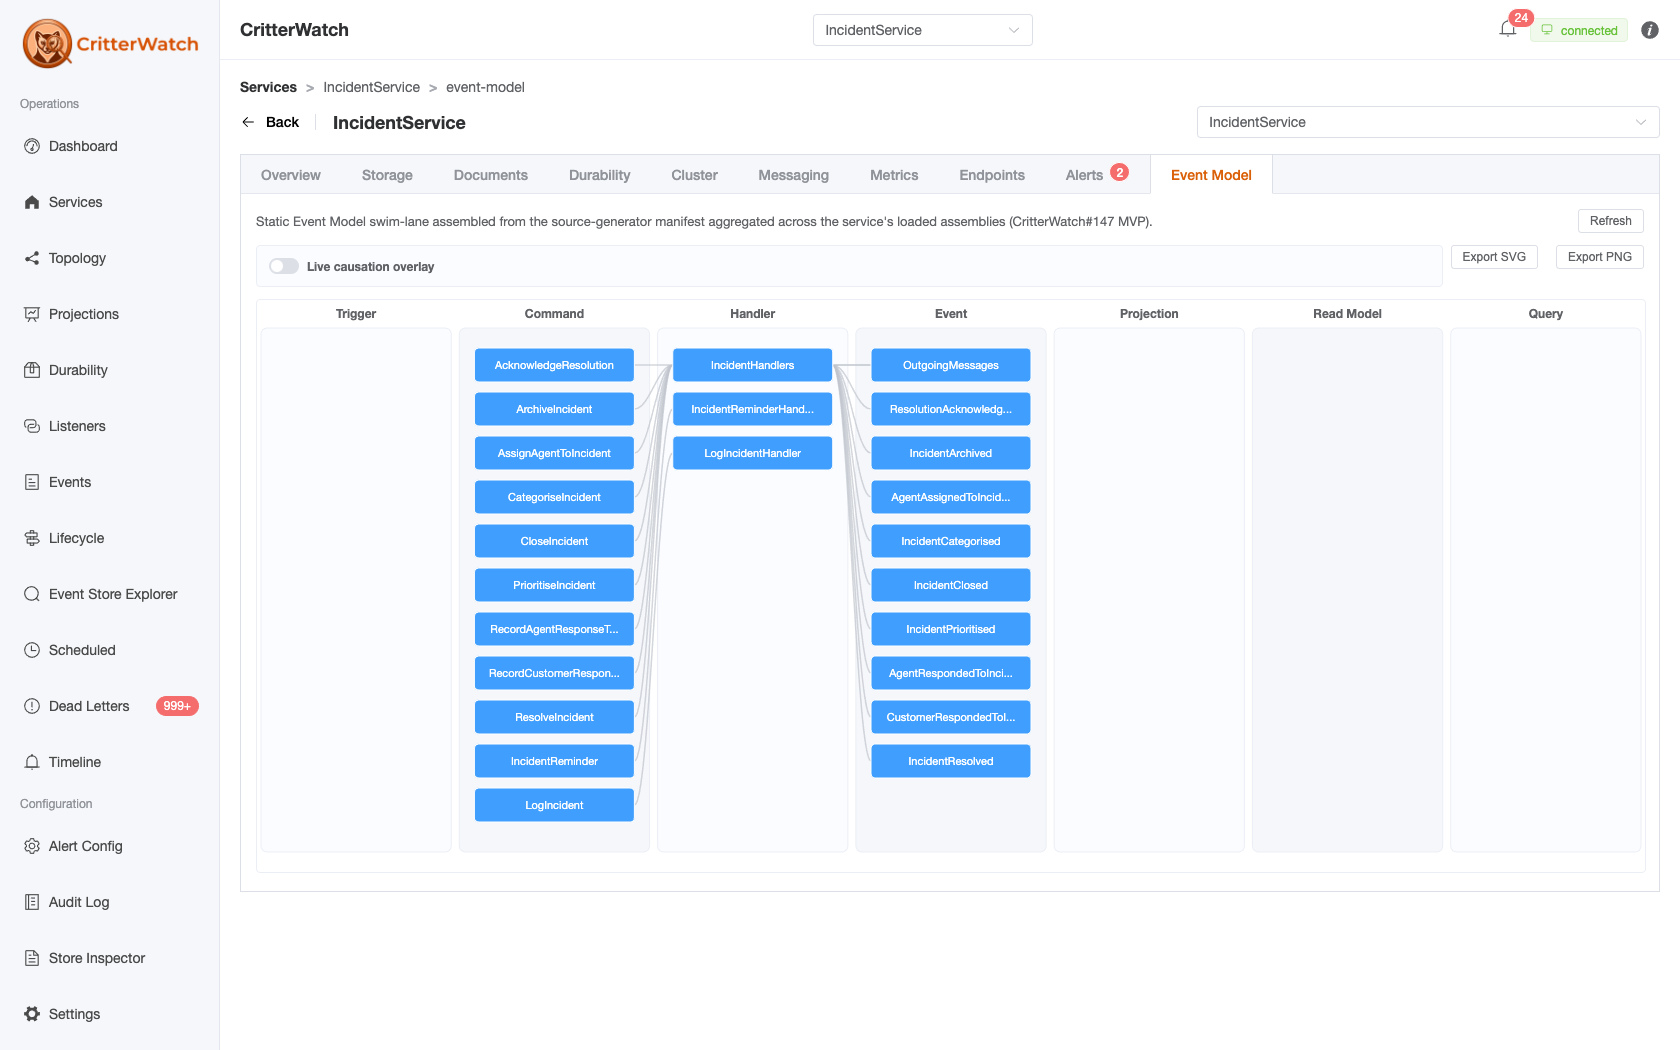
Reach it from Explore → Workflow (/workflow), then the Event Model segment of the view-mode toggle in the scope bar. The choice sticks across visits and rides the URL, so /workflow?type=Some.Type&mode=lanes is a shareable deep link.
History (#658). There used to be a second, per-service swim-lane on the Event Store Explorer's Configuration tab, rendered by
SwimlaneView.vueover a seven-lane projection (lifecycleToLanes). It was deleted as superseded — the fleet-wide canvas described here is a strict superset, because it stitches across service boundaries and merges sources a single service cannot. Older revisions of this page describe seven lanes, a Configuration-tab surface, and Export SVG / Export PNG buttons on that tab. None of those exist. The Configuration tab's "How do these fit into the system? →" affordance survives and now seeds this canvas instead.
The two models on this screen, and why the Event Model is not the other one
The Workflow screen's Flow Graph mode draws the lifecycle — the inferred ∪ observed ∪ confirmed graph the server's lifecycle assembler builds for one traced subject. That is a per-subject, participant-shaped model, and it is what Workflow documents.
The Event Model mode normally draws something else: the console's assembled, fleet-wide Event Model, fetched from GET /api/critterwatch/event-model. It needs no traced subject — the merge is fleet-wide by construction — so this mode has no "pick a subject first" gate.
A single-source picture cannot disagree with anything. That is the whole reason the two are separate, and the canvas always says which one you are looking at (see The source badge).
What gets merged
The endpoint enumerates every registered IEventModelDefinitionSource and folds the results with EventModelDescriptor.Merge. In a stock console that is:
| Source | Provenance | What it contributes |
|---|---|---|
ObservedEventModelSource | Observed | What the console has actually watched your services do. The top rung — production outranks any claim about the code. |
CachedManifestEventModelSource | Derived | Each monitored service's own model, pushed at activation as EventModelManifestPushed and cached by the console. That manifest is itself already a merge of that service's sources, so a hand-written overlay (services.AddEventModel(...)) in your app arrives through here. |
Two more sources exist in the console's DI and are excluded by default: Wolverine's own chain-derived source and Wolverine.Http's route source, both of which describe CritterWatch's own handlers. On a genuinely cold console they contributed 111 slices — every one of them the console describing itself — against 10 for a small monitored app. That is a floor of noise present before you monitor anything, so it is off unless you ask: ?includeConsole=true puts it back, and the cw-event-model CLI command carries the console's own picture unconditionally.
One service at a time (#1215)
The model picker above the canvas chooses what is merged. It defaults to Whole fleet — the read the canvas has always made — and lists every monitored service, pinned ones first.
The choice matters because EventModelDescriptor.Merge folds slices by name. That is exactly right within one application: it is how Declared, Derived and Observed fold into one slice. Across applications it is wrong. On the whole-fleet model, two services with a same-named command render as one slice, and that slice's lists union, so it can advertise emitted events that no single service emits. On the 28-service dev fleet, HelpDesk and Incidents collide on six commands, and 17 of 20 sources disagree hotspots were that fusion rather than real drift. The fleet view says so beside the picker.
Picking a service reads GET /api/critterwatch/event-model?service=<name>, which merges only the sources describing that service. The console's own slices never appear there, so includeConsole does not apply. The canvas clears while the new model loads rather than showing the previous service's slices under the new name. A service that has not pushed a manifest, and whose behaviour has not been observed, shows an empty state naming it, with the picker still there to choose another.
Provenance is a ladder of authority, not the Flow Graph's reconciliation axis. The two share words and are deliberately kept apart.
Declared/Derived/Observedanswers which source wins; the Flow Graph'sinferred/observed/confirmedreconciles one edge across static and runtime discovery, whereconfirmedmeans "both agree" and not "seen in production". The Event Model canvas expresses agreement as the absence of a disagreement hotspot rather than as a fourth value.
What you see
Lanes
Four horizontal lanes, top to bottom, drawn by the shared @jasperfx/event-model-vue renderer — the same package and the same picture the Bobcat console draws:
| Lane | What lands here |
|---|---|
| Wireframe / Trigger | The transport or route a command arrives on — HTTP route, queue, scheduled origin. |
| Command | Command cards, and the machinery around them: handlers, messages, external systems, and hotspot stickies. |
| Event Stream | The appended events. |
| Read Model | Projections and the read models they produce. |
Slices
Vertical slices are the unit of the model, classified into the four Event Modeling patterns — command, view, automation, translation. They render as a chip strip above the canvas; clicking a chip collapses that slice to a placeholder column (click again to expand). The chip carries the slice's pattern and its artifact count — hotspots are annotations, not artifacts, and are deliberately not counted.
Evidence dots (#658)
When a Bobcat spec monitor is configured, each slice chip gets a status dot joining spec-run evidence to the slice by name:
| Dot | Meaning |
|---|---|
| 🟢 green | every bound spec passed |
| 🔴 red | a bound specification failed |
| 🟡 yellow (filled) | drift — a spec is pending/not run, or the run touched types the slice does not declare |
| 🟠 orange (hollow ring) | no specification bound to this slice — absence drawn as absence |
A dimmed dot means the evidence is stale, from an old run. Hover any chip for the failing / not-run / undeclared-touch detail. With no monitor configured the strip renders exactly as it did before evidence existed.
Which run, against which model (#1213). Beside the strip the console names the pairing it is showing — specs: run 'X' vs model 'Y'. A Bobcat monitor serves one event model to every consumer — from Bobcat 0.18 on, merged from separately published halves that share a model name — and a separate list of runs. So a console pointed at a shared monitor can be handed a run from one application and a model from another, and both look fine on their own. When both sides carry spec identities and none match, the pairing turns amber and reads different applications?. The dots stay — nothing is dropped — but they dim, and each chip's tooltip says the colour is probably not about that slice.
A model that binds no specifications at all cannot be compared, and is named without a warning. That is the state of a model published from the application alone, because the spec bindings live in the test assembly. Publish both halves, as described next, to get dots.
Publishing the model to Bobcat (#1212)
The dots need a model that knows both your code and your specs, and no single process can produce it:
- The application knows its handler, HTTP and gRPC chains and any overlay you registered.
- The spec assembly knows which slice each specification binds, through the
BobcatEventModelSourcethat Bobcat generates into it. That type isinternalto the test assembly, and the application cannot reference its own spec project.
So each publishes its own half to its own named source, and the monitor merges them. This needs Bobcat 0.18 or later, which stores a model per source (PUT /api/event-model/{source}) and merges the halves when it serves GET /api/event-model. Earlier monitors keep one model, and each publish replaces the last.
The application's half comes from Wolverine's event-model command. --url is the full endpoint, including the source name:
dotnet run -- event-model --url http://localhost:5525/api/event-model/hostThe specs' half has to be published from code in the spec assembly, such as a fixture or a run hook, where the generated source is visible:
public static async Task PublishSpecHalfAsync(
    IEventModelDefinitionSource specSource, // BobcatEventModelSource.Instance, from the spec assembly
    IServiceProvider services,              // the booted host's root services
    HttpClient http,
    string bobcatUrl,                       // e.g. http://localhost:5525
    CancellationToken token)
{
    var specs = await specSource.TryCreateAsync(services, token);
    if (specs is null) return;

    // The same JSON the application's `event-model` command writes
    var json = WolverineEventModelExport.ToJson(specs.WithProvenance(specSource.Provenance));

    var response = await http.PutAsync(
        $"{bobcatUrl.TrimEnd('/')}/api/event-model/specs",
        new StringContent(json, Encoding.UTF8, "application/json"),
        token);
    response.EnsureSuccessStatusCode();
}
Rules that hold the merge together:
- Both halves must carry the same model name. The application's half is named for
opts.ServiceNameunless you pass--name. The spec half takes its name from[assembly: EventModelName("...")]in the spec assembly. A half with a different name is stored but not merged. - Source names are letters, digits,
-and_. A barePUT /api/event-modelwrites to the sourcedefault. - Order does not matter. Each PUT replaces only its own half. The spec half on its own is already enough to bind evidence. The application's half adds the slices no spec covers, and those are the ones that show the orange ring.
- Nothing publishes the halves for you yet. A Bobcat run does not push the spec half, and the application does not push its half on startup (bobcat#294). Publish them when the code or the specs change, typically in the same script that runs the specs.
- A monitor remembers. Bobcat persists published halves and runs to its data directory (
Monitor:DataPath, orBOBCAT_MONITOR_DATA). A monitor shared across applications, or reused across sessions, serves whatever was published there last. Give each application its own data directory when that matters.
Verified against Bobcat 0.19.0 with its BankAccountES sample (Fisher). The merged model had 10 slices, 6 of them bound to specs. The console reported the run as corresponding to the model, with 8 of 16 scenarios bound to a slice. The other 8 are expected to be unbound: two scenarios exercise query slices the spec generator does not bind, and six are deliberately untagged.
The legend
Three rows, and each appears only when the canvas actually contains what it describes — a key to nothing is the same defect as documenting an API that does not exist:
- observed in production — the corner wedge on a card. Production has been seen doing this; cards with no wedge were derived from the code.
- hotspot — a pink sticky: an open question or a pending specification.
- sources disagree — a magenta outline. Two sources describe this differently, most often production doing something the code does not say it does. Emitted by the merge and never by a source, so it can only appear on the assembled model.
The source badge
The canvas states which model it is drawing, because a silent fallback here would be the worst outcome: the page would look authoritative while showing a single-source picture that cannot disagree with anything — indistinguishable on screen from a merged model that found no disagreements.
| Badge | What it means |
|---|---|
| (none) | The assembled multi-source model, current. The intended state, so it gets no chrome. |
| assembled model may be stale | The last good merge is on screen and the most recent refresh failed. Anything that changed since — including new source disagreements — is not shown, and their absence is not evidence there are none. |
| live only — nothing assembled yet | No assembled model for this scope yet; drawing the traced subject's live lifecycle alone. One source, so nothing here can disagree. |
| live only | Same, while the assembled model is still loading. |
| live only — model unavailable | The assembled model could not be read at all. Source disagreements are not being shown. |
The live-lifecycle descriptor is a fallback, not a second mode. There is deliberately no toggle between the two: the merge exists precisely to answer "which source is right?", and offering two side-by-side views of the same workflow hands that question back to you.
Drill-down
Clicking a card navigates rather than opening a drawer:
- a card that maps to a handler opens that service's handler-chain detail page,
- a projection card opens its projection detail page,
- a card that is a message/event type and is not already the seed re-seeds the Workflow screen on that type (
/workflow?type=<FullName>) — the natural drill-down when the card is a type.
Clicking a slice header collapses that slice, the same as its chip.
Getting here from elsewhere
- Event Store Explorer → Configuration — the Event Types table's How do these fit into the system? → button lands on the Workflow screen; each event type's CLR-type link seeds it on that type.
- View in Workflow buttons on message-type, handler, HTTP and gRPC detail pages, and on graph selections, route to
/workflow?type=<FullName>. /lifecycle?type=redirects to/workflow?type=, preserving the query.
Refresh (#1190)
The assembled model re-reads itself when it changes, driven by the assembled_event_model_changed nudge the console publishes after it commits a service's pushed manifest — the moment the endpoint's answer actually moves. It is not a poll: the endpoint assembles a multi-source merge on every call, so polling would pay that cost forever to catch an event that happens at deploy cadence.
Two details that are load-bearing rather than incidental:
- Every invalidation is fleet-wide on purpose. The merge folds by slice name across services, so one service's push can move a slice another service also describes. There is no correct per-service partial refresh of a model assembled that way.
- A fleet coming up is one refresh, not N. Pushes within 400 ms of each other collapse into a single read.
This is also what makes assembled model may be stale reachable in normal operation — refetches are routine traffic now, so a failed one strands a stale canvas that would otherwise read as authoritative. That is the badge's purpose, not a side effect of the refresh.
Exports
The Workflow screen's export dropdown (Copy as Mermaid / PNG / SVG) captures whichever view mode is active, including this one.
⚠️ The export toolbar only appears once a subject has been traced, because Copy-as-Mermaid needs a lifecycle. The Event Model canvas itself needs no subject, so on a freshly-opened screen showing the merged model there is no export toolbar until you trace something.
Architecture (for developers)
The merged path (normal)
EventModelingView.onMounted
  →  assembled-event-model-store.fetchModel()
  →  GET /api/critterwatch/event-model
       →  EventModelEndpoint.Get  →  every IEventModelDefinitionSource except the host's own
       →  EventModelDescriptor.Merge  →  StoreJsonResults.WriteAsync
  →  EventModelDescriptor  →  <EventModelView> (@jasperfx/event-model-vue)
🩸 The endpoint writes through StoreJsonResults, and that is load-bearing. The BFF's default HTTP JSON applies JsonStringEnumConverter(JsonNamingPolicy.CamelCase), which would put "observed" on the wire where the renderer matches "Observed" — and it would fail silently: no provenance wedge, no hotspot outline, and vue-tsc cannot see it because the JSON arrives untyped. StoreJsonResults uses JsonSerializerDefaults.Web plus a plain JsonStringEnumConverter() — camelCase properties, PascalCase enum values — matching what cw-event-model and the Bobcat export put on the wire. event_model_endpoint_tests asserts the spelling; do not trust a default.
The live fallback
useWorkflowModel(seed).trace()  →  GET /api/critterwatch/lifecycle/{seed}?depth=N  →  Lifecycle
  →  lifecycleToEventModel()   (derives command/event/read-model cards, rewires the machinery,
                                classifies the four-pattern slices)
  →  lifecycleToDescriptor()   (maps that onto the shared renderer's descriptor shape)
→ <EventModelView>lifecycleToEventModel(src/composables/lifecycleToEventModel.ts) stays the single source of truth for what appears. It is a pure, DOM-free projection with a deterministic grid layout — the canonical EM orientation is the layout, so there is no elk and no async.lifecycleToDescriptor(src/composables/lifecycleToDescriptor.ts) adapts it toEventModelDescriptor. Two consequences of the shared slice-column model: each card belongs to exactly one slice (cards no slice claims land in a trailing pattern-less slice named for the seed, so nothing vanishes), and an edge whose endpoints live in different slices is dropped — the renderer draws slices as columns and would drop it at layout anyway.EM_ROWSinlifecycleToEventModelstill has five internal rows;laneOffolds them onto the renderer's four lanes. Do not read the five as the drawn lanes.
Stores
| Store | Holds |
|---|---|
assembled-event-model-store | The one fleet-wide assembled descriptor. This is the model the canvas draws. |
event-model-store | ⚠️ A different thing with a confusingly similar name — the per-service manifests requested over SignalR, answering the Event Store Explorer's "Used by" panel. |
spec-evidence-store | Bobcat spec-run evidence (GET /api/critterwatch/spec-evidence) for the chip dots. Unconfigured and unreachable both arrive as data, never a 500. |
Troubleshooting
The canvas is empty and says "No assembled Event Model yet". No source contributed a slice — most often no monitored service has pushed its manifest and nothing has been observed yet. Trace a subject in the scope bar to draw its live workflow in the meantime.
It says "Loading the assembled Event Model…" and stays there. The endpoint read is in flight or timed out (10 s). Check that the console can reach its own BFF; the badge flips to live only — model unavailable once the read fails.
I see no "sources disagree" row, so my sources agree. Only if the badge is absent. Under assembled model may be stale or any live only badge, disagreements are not being computed or shown, and their absence tells you nothing.
Every slice chip has an orange ring. The monitor's model carries no spec bindings. Most often only the application's half was published: its own event-model export cannot see the specs, so publish the spec half too (see Publishing the model to Bobcat). If the halves were published under different model names, Bobcat stores both and merges neither. Otherwise, no spec is bound to these slices. With no monitor configured at all, the dots do not render.
The spec pairing reads different applications? and the dots are dimmed. The monitor's published model and its newest run are from two different applications — most often a shared monitor where someone else pushed the model last. Read the model name and the suite in the pairing's tooltip. The console cannot fix the monitor's single-model shape; it can only stop presenting the mismatch as evidence.
My service's slices never appear. The derived half comes from the manifest a service pushes at activation. Confirm the service is registered and actually activated — the observed half only fills in as messages flow, so a service that has done nothing yet contributes nothing.
The console's own handlers are all over my model. You are on ?includeConsole=true. Drop it.
A slice from two different services merged into one. EventModelDescriptor.Merge folds by slice name and ignores each descriptor's own name. Two services with a same-named slice become one slice. That is the documented behaviour, and nothing yet distinguishes a genuine cross-service slice from a name collision.