
Event Store Explorer
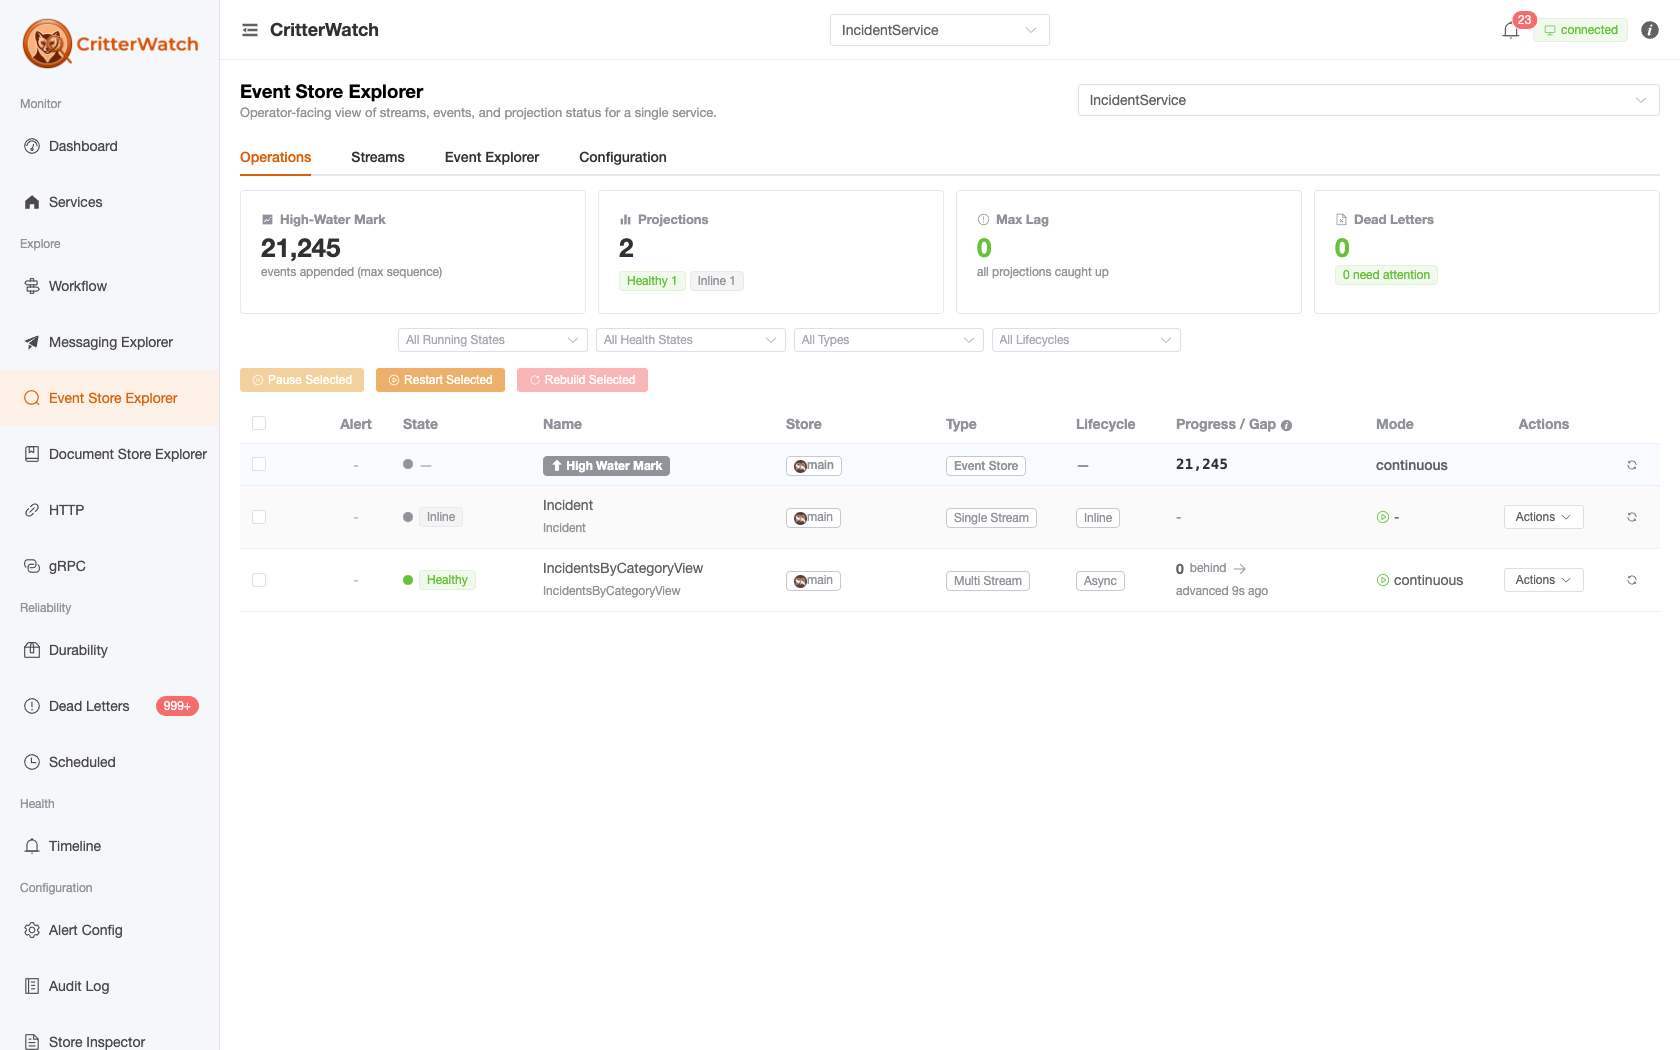
The Event Store Explorer is the operator-facing window into a monitored service's event store — its domain streams, the events inside them, its projections, and its event-store configuration. It reaches into the monitored service over Wolverine.CritterWatch's EnableEventStoreExplorer round-trips.
Route: /explorer (the retired standalone /events page redirects here).
Three similarly-named surfaces — don't conflate them
- Event Store Explorer (
/explorer) — a monitored service's event store (domain streams, events, projections, config). You are here. - Store Inspector (
/raw) — the console's own frontend state (Pinia stores + the live SignalR message log). A debugging surface. - Timeline / Audit Log — CritterWatch's own system events and operator actions.
Opt-in
The explorer is gated by CritterWatchOptions.EnableEventStoreExplorer on the monitored service — not on the console. The default is true in Development and false everywhere else. When disabled, the page renders an "Event Store Explorer is disabled on this service" banner — flip the option to opt in:
builder.Host.UseWolverine(opts =>
{
    opts.ServiceName = "my-service";

    var critterWatch = opts.AddCritterWatchMonitoring(
        critterWatchUri: new Uri("rabbitmq://queue/critterwatch"),
        systemControlUri: new Uri("rabbitmq://queue/my-service-control"));

    // On by default in Development, OFF everywhere else. Event payloads are business data:
    // turning this on lets anyone with console access (and MCP callers holding
    // mcp.events.query) read this service's events.
    critterWatch.EnableEventStoreExplorer = true;
});
Since 1.1 the opt-in covers every read of event data — stream history, tag and filter queries, the stream fetch, and the query_events MCP tool. Before 1.1 the by-metadata query, which returns full event bodies, ignored it (GH-1211); see the upgrade note. Event payloads are business data: opting a service in exposes them to anyone with console access, and to MCP callers holding mcp.events.query.
Tabs
Pick a service (and, on a multi-store service, a store) from the selectors at the top; a tenant picker appears for tenant-partitioned stores. The page is organised into four tabs.
| Tab | What it shows |
|---|---|
| Operations | The projection-operations dashboard for the selected store — a metrics header plus the full projections table (per-projection health, lag, dead-letter counts, and the Pause / Restart / Rebuild row actions). This is where the former standalone Projections page folded in. |
| Streams | A faceted search over the service's streams — filter by stream type, tenant, stream-id substring, and a stream-version range, and sort by recently-updated (the default), recently-created, or highest version. Each row carries contextual verbs, including Step (see the Projection Stepper below). On a store with more than one database (database-per-tenant, sharded) the listing is answered once per database and a Database column says which one each row came from; opening a row reads its stream from that database, because a stream id is unique within a database and not across them (#1237). | | Event Explorer | Read the events themselves — browse a stream's ordered event history, run tag/DCB queries, and follow "used-by" links from an event type to its consumers. | | Configuration | The selected store's event-store configuration: database cardinality/engine/schema, queryable metadata, its event types, and its subscriptions and projections. The How do these fit into the system? → link (and each event type's CLR-type link) opens the Event Model view on the Workflow screen — the swim-lane that used to render inline here was retired in #658. |
The Operations tab
Beyond the projections table, three things on this tab answer questions the table itself cannot.
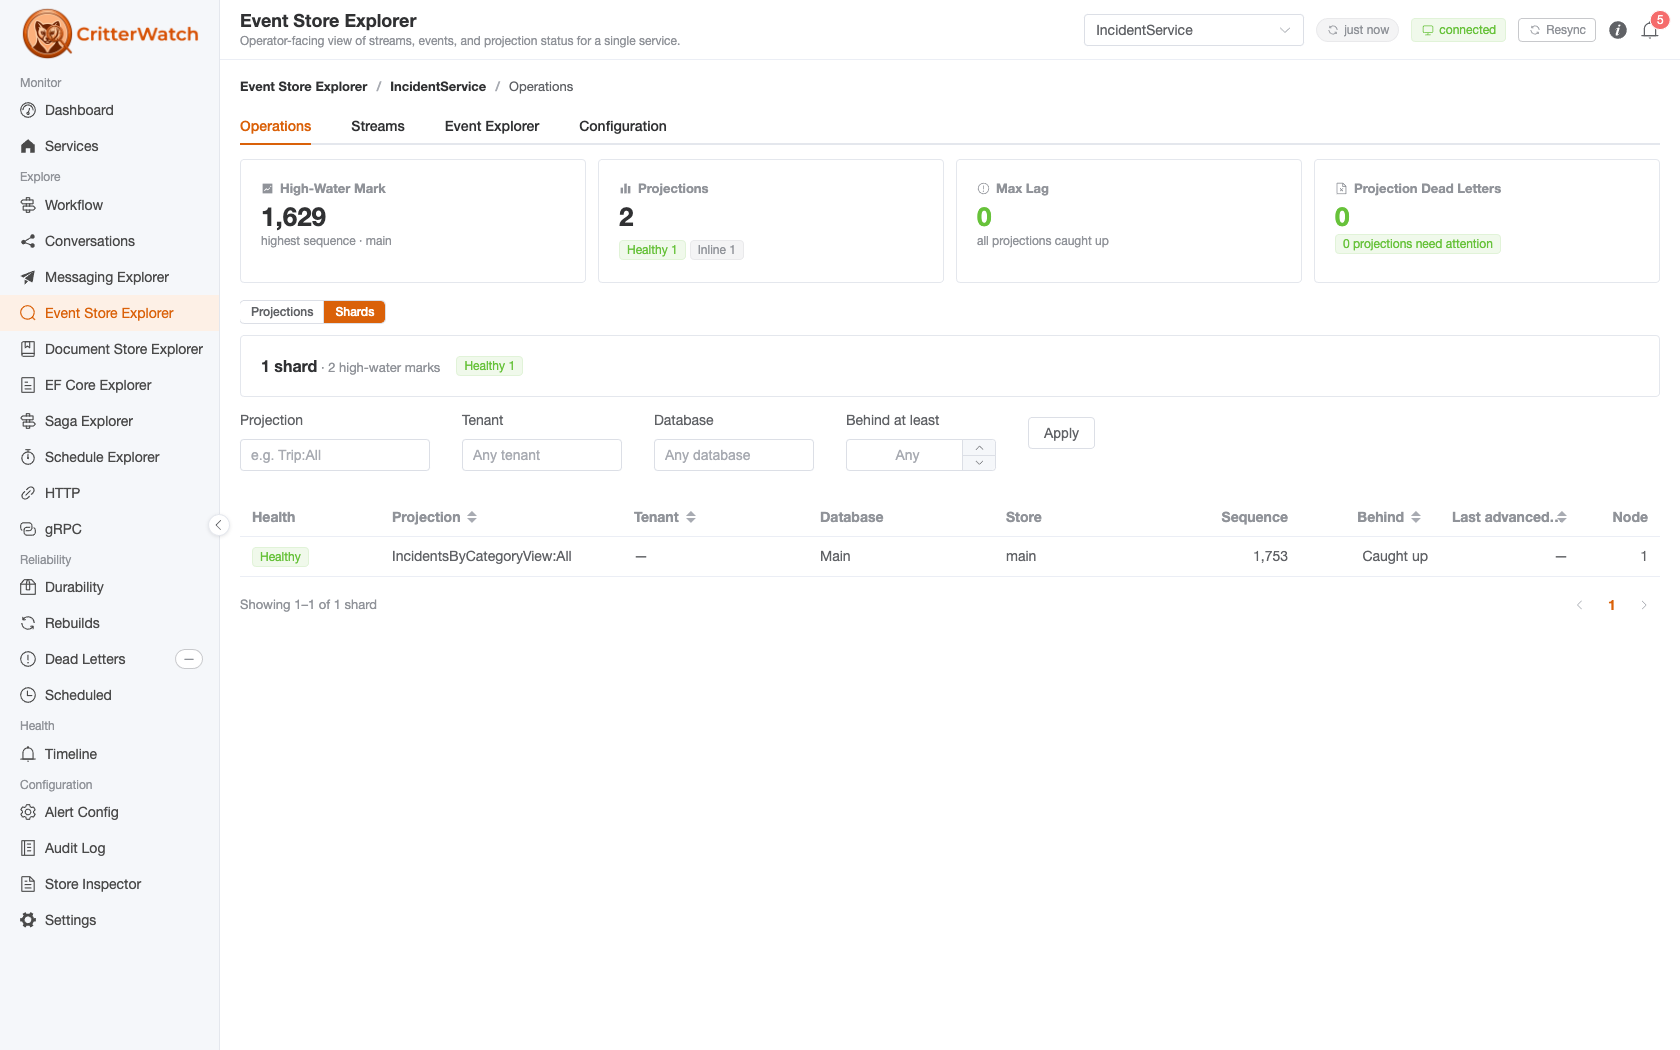
A rollout panel, when there is a rollout. When more than one version of a projection is live at once, a panel appears above the Projections / Shards grain toggle showing old version vs new, shards remaining, the rate events are being consumed at, an ETA, and the verdict an operator is actually waiting for — is the new version level across the fleet?
It renders nothing the rest of the time, by design
Almost every service runs one version of each projection forever. A panel that read "Level" on every service every day would be ignored by the time it mattered, so it appears only when a rollout is in flight — and is then the first thing on the screen. Its absence means "one version live", not "not measured". (GH-1223)
It sits above the grain toggle because "is the new version level?" is a question about the service, not about whichever grain happens to be selected.
Where a shard's gap was measured from. A shard's gap cell names the high-water mark it was measured against — "Measured against the mark for tenant acme in db-3", "…for database db-3", "…the store-wide mark" — and how many other rows on the page share that same denominator. On a fleet where 272 behind shards were only 79 distinct (database, tenant) pairs, an operator paging worst-first was reading the same fact over and over; the shared-mark count says so outright. (GH-1218)
A row's scope may legitimately differ from its own tenant
Under conjoined tenancy a per-tenant row inherits its database's mark, so a row whose tenant is acme can correctly read "the mark for database db-x". That mismatch is the diagnostic — it is not a bug to be fixed. The service-wide fallback deliberately names no scope at all: its key is whichever mark carried the largest sequence, so the shard was never measured against a member of the scope that key names, and printing one would be a precise-looking attribution that is fabricated.
Unassigned is its own verdict. A shard that has never started on a database reads Unassigned rather than being reported as stopped or silently folded into a healthy count — a never-started shard and a deliberately stopped one are different operational facts. (GH-1234, GH-1236)
Event Explorer: three views
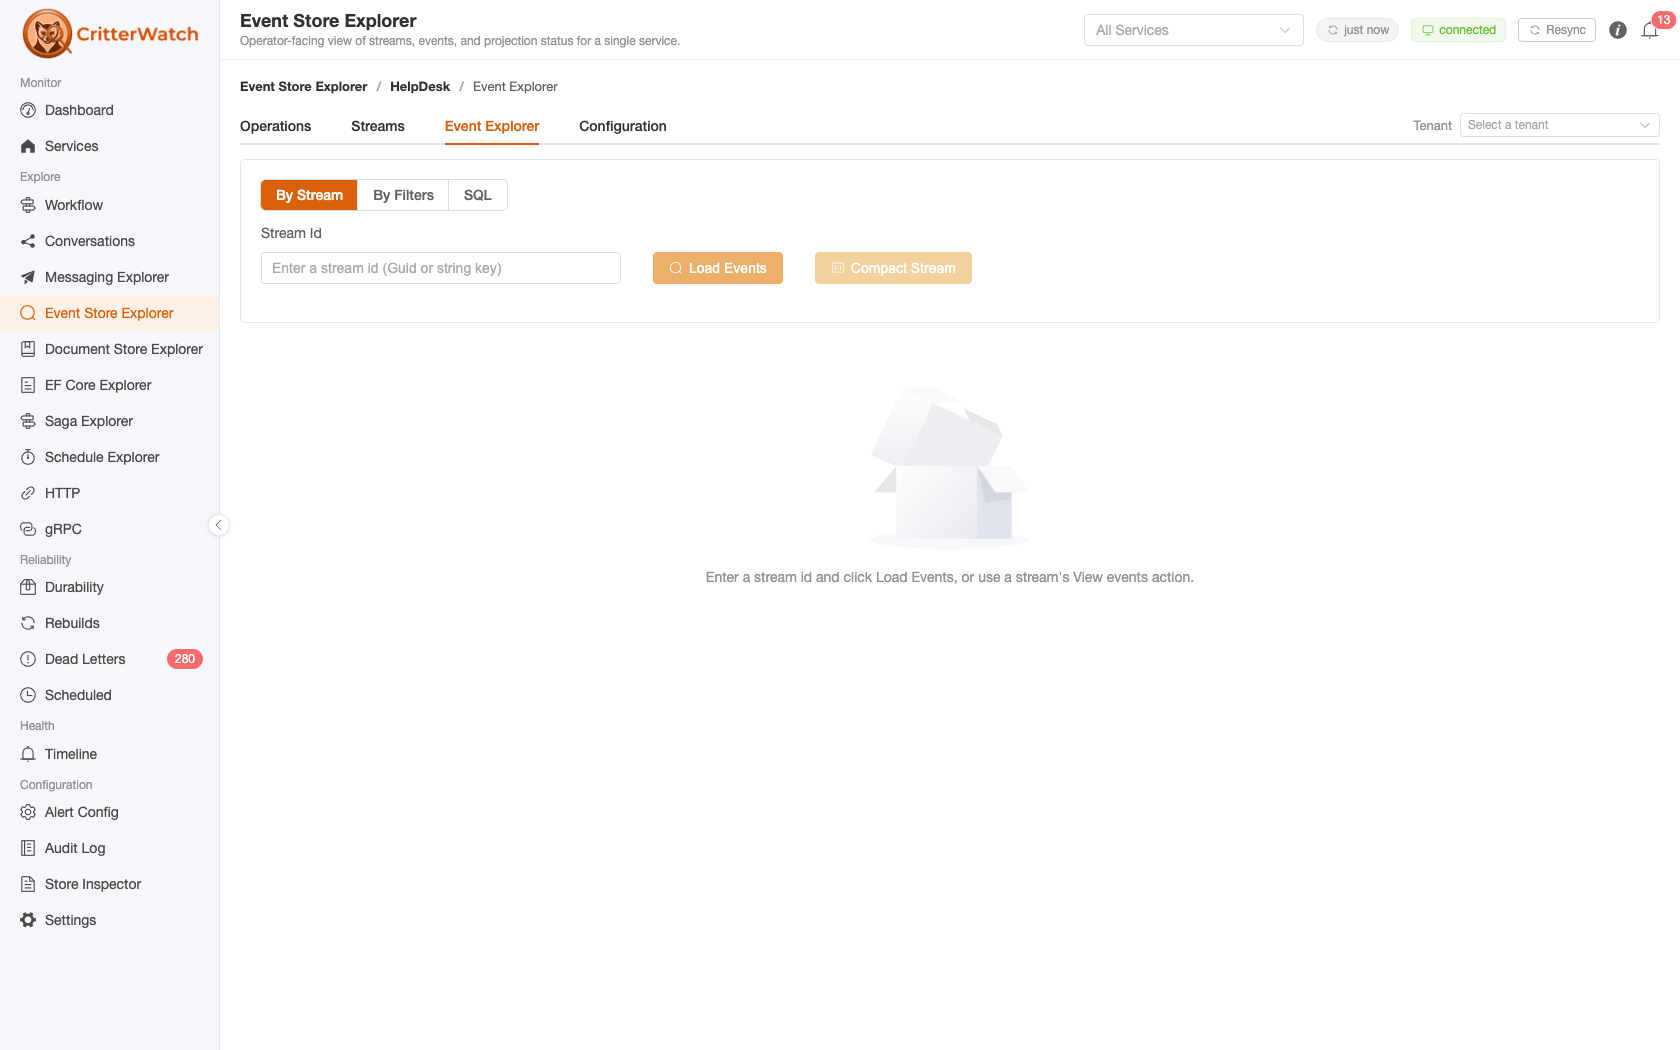
| View | Answers |
|---|---|
| By Stream | One stream's ordered history, with its stream state and metadata. |
| By Filters | A cross-stream query combining any of the filters below — DCB tags included. All of them AND together, and the result carries a total count of the combined match. |
| SQL | The question the filters cannot express — a join to a projection table, a GROUP BY over a payload field, a count per stream — as one read-only SELECT in the store's own dialect, run on the monitored service. See the SQL view below. |
Until 1.1, tags were a separate By Tag mode that could not be combined with anything else — and did not work at all against a Fisher (SQLite) store or a store-global Polecat (SQL Server) one, because it used a tag query those stores do not implement. Tags are now one facet of the single query, which all three stores honour (GH-1211). A tag-only query is still a valid step source for the Projection Stepper; tags combined with any other filter are not, because the stepper has no metadata run mode.
The DCB Tags facet takes one or more name/value pairs, and every one must match. Names are the tag types the selected store reports as registered; an unregistered name is refused by the store with a message listing the ones that are, never answered with an empty page.
The other filters are event type (single) and Also Event Types (several — an event matches if its type is any of them), stream id, a time window, a sequence range, and whichever of correlation id / causation id / user name the selected store advertises as queryable. Both windows are inclusive at both ends and may be half-open — supply one bound and leave the other empty. An inverted window (a floor above its ceiling) is well-formed and simply matches nothing; it is never an error.
Because the result carries a total count, a time window turns the panel into a counting tool: "how many of this event type happened between Tuesday and Thursday" is one query, not a page-through.
WARNING
If a monitored service did not apply a filter you asked for, the page says so and does not show the rows. A service running an older Wolverine.CritterWatch has no member to deserialize the newer filters into and drops them silently, which would otherwise return a full unfiltered page that is indistinguishable from a correctly filtered one. Every response echoes the filters the service actually applied, and a shortfall — or no echo at all — is reported as an error rather than rendered as results. Upgrade the service's Wolverine.CritterWatch package to clear it.
The same filters and the same guard are available to agents through the query_events MCP tool, and on the command line through JasperFx.Events' event-query command.
The SQL view
Since 1.1 (GH-1235) the Event Explorer has a third view: type one SELECT, press Run (or Ctrl/⌘-Enter), and the statement runs on the monitored service, on its own connection, against the selected store's database. The console never holds database credentials; the rows come back over the same channel every other explorer read uses. The view names the engine you are writing for — PostgreSQL for Marten, T-SQL for Polecat, SQLite for Fisher — and lists the tables you may reference, because that list is what the store itself declares.
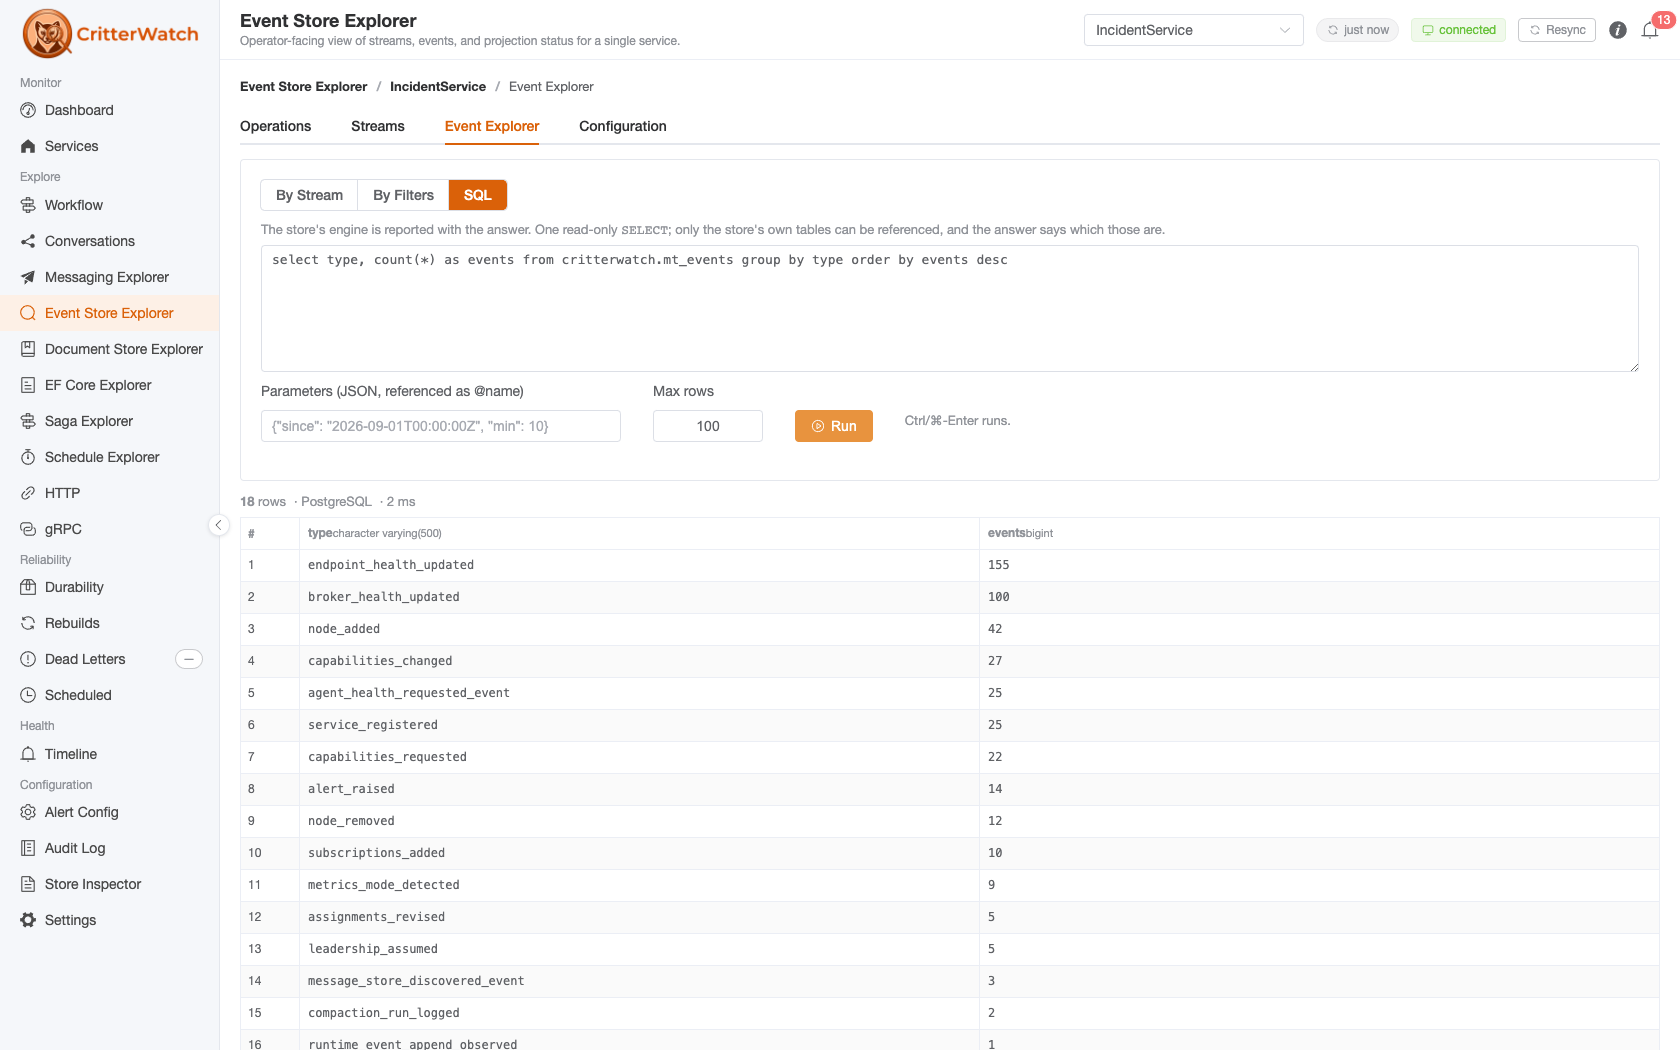
It is the escape hatch beside By Filters, not a replacement for it. Everything the filters can express is better asked there: the same query works on all three stores with no dialect, and the answer carries a total count. SQL is for the rest — a join from events to a projection document table, a GROUP BY over a payload field (data->>'customerId' on Marten, JSON_VALUE(data, '$.customerId') on Polecat, json_extract(data, '$.customerId') on Fisher), a per-stream count, a look at a tag table.
What the monitored service enforces, in this order:
One
SELECT(orWITH … SELECT). A second statement after a semicolon, andINTO, are refused before anything is opened.Table references are allow-listed to the objects the store declares: its event, stream, tag and progression tables and its projection document tables. A reference outside them — another schema, a system catalog, a typo — is refused with the allowed names listed, never answered with an engine error. The list is what the store has declared so far; a brand-new store with no event types registered yet declares no event table.
A read-only transaction that is always rolled back. PostgreSQL runs
SET TRANSACTION READ ONLY, SQLitePRAGMA query_only; SQL Server has no read-only transaction, so there the rollback is the guarantee. The allow-list states intent; the rollback is what makes a write impossible.A statement timeout (30 s by default, 120 s at most) and a row cap (100 by default, 1,000 at most). A statement that produces more rows than the cap comes back marked truncated: the rows shown are the first N in the statement's own order, so put an
ORDER BYand aLIMIT/TOPin the statement rather than relying on the cap. A cell longer than 32,000 characters is cut and counted.The 1,000-row ceiling is the contract, and there is no page control — not in the view, the message or
query_sql. This is deliberate rather than unfinished: it is an operator diagnostic, and a page control over an arbitrarySELECTis wrong in one of two ways. ALIMIT/OFFSETwrapper re-runs the statement per page and, on a statement with noORDER BY, silently overlaps or skips rows; a server-side cursor pins a connection across pages and conflicts with the timeout that bounds the feature. To reach rows beyond the cap, window in the statement itself —ORDER BY … LIMIT n OFFSET mon PostgreSQL and SQLite,ORDER BY … OFFSET m ROWS FETCH NEXT n ROWS ONLYon SQL Server — which is the only paging that is correct for a statement you wrote.
Every cell is shown as text with its column's type; a JSON column (jsonb, nvarchar holding JSON) opens in the JSON viewer. Parameters are @name placeholders in the statement with values typed by inference — an integer, a decimal, a boolean, otherwise text — so where seq_id > @floor works on the strict engines.
Two things about who may do this. The view is license-gated like the other operator surfaces, and on a console with permissions wired it requires the sql.query capability scoped to the store — the one relayed read that carries a capability, because a SELECT * over a projection table reads more than any filter does. And every run is written to the Audit Log with the statement, the store and who ran it, from the console and from the query_sql MCP tool alike.
On a database-per-tenant store, pick the tenant in the scope bar: the statement runs against that tenant's database. On a multi-database store with no tenant chosen the service refuses and lists the databases — it never picks one for you. On a single-database, conjoined-tenancy store the tenant is a column, and scoping it is your WHERE clause.
The same statement, guard and answer are available to agents through the query_sql MCP tool. There is no CLI twin inside the stack for this one: psql, sqlcmd and sqlite3 against your own store are that twin, and always were.
Opting in
SQL follows the explorer opt-in unless told otherwise: with EnableEventStoreExplorer on, SQL is on. CritterWatchOptions.EnableSqlQuery = false keeps the structured views and refuses SQL; true allows SQL on its own. Like the explorer, the default is on in Development and off everywhere else.
Projection Stepper
The Projection Stepper is a contextual drawer, not a standing tab: open it with a stream's Step verb (or the Event Explorer's step-through action) to replay a projection over a chosen source slice and watch each event mutate the aggregate, one step at a time. It honors any registered SingleStream / MultiStream projection regardless of lifecycle.
Deep link from a service
A service's Storage / Event Store surface links straight into this explorer with the service pre-selected, so you can go from "which stores does this service have?" to browsing one of them in a click.