
Settings
The Settings page (/settings) is the control surface for everything that's about CritterWatch itself rather than about a specific monitored service — refresh cadence, theme, notification channels, trace providers, license, connection behaviour, retention.
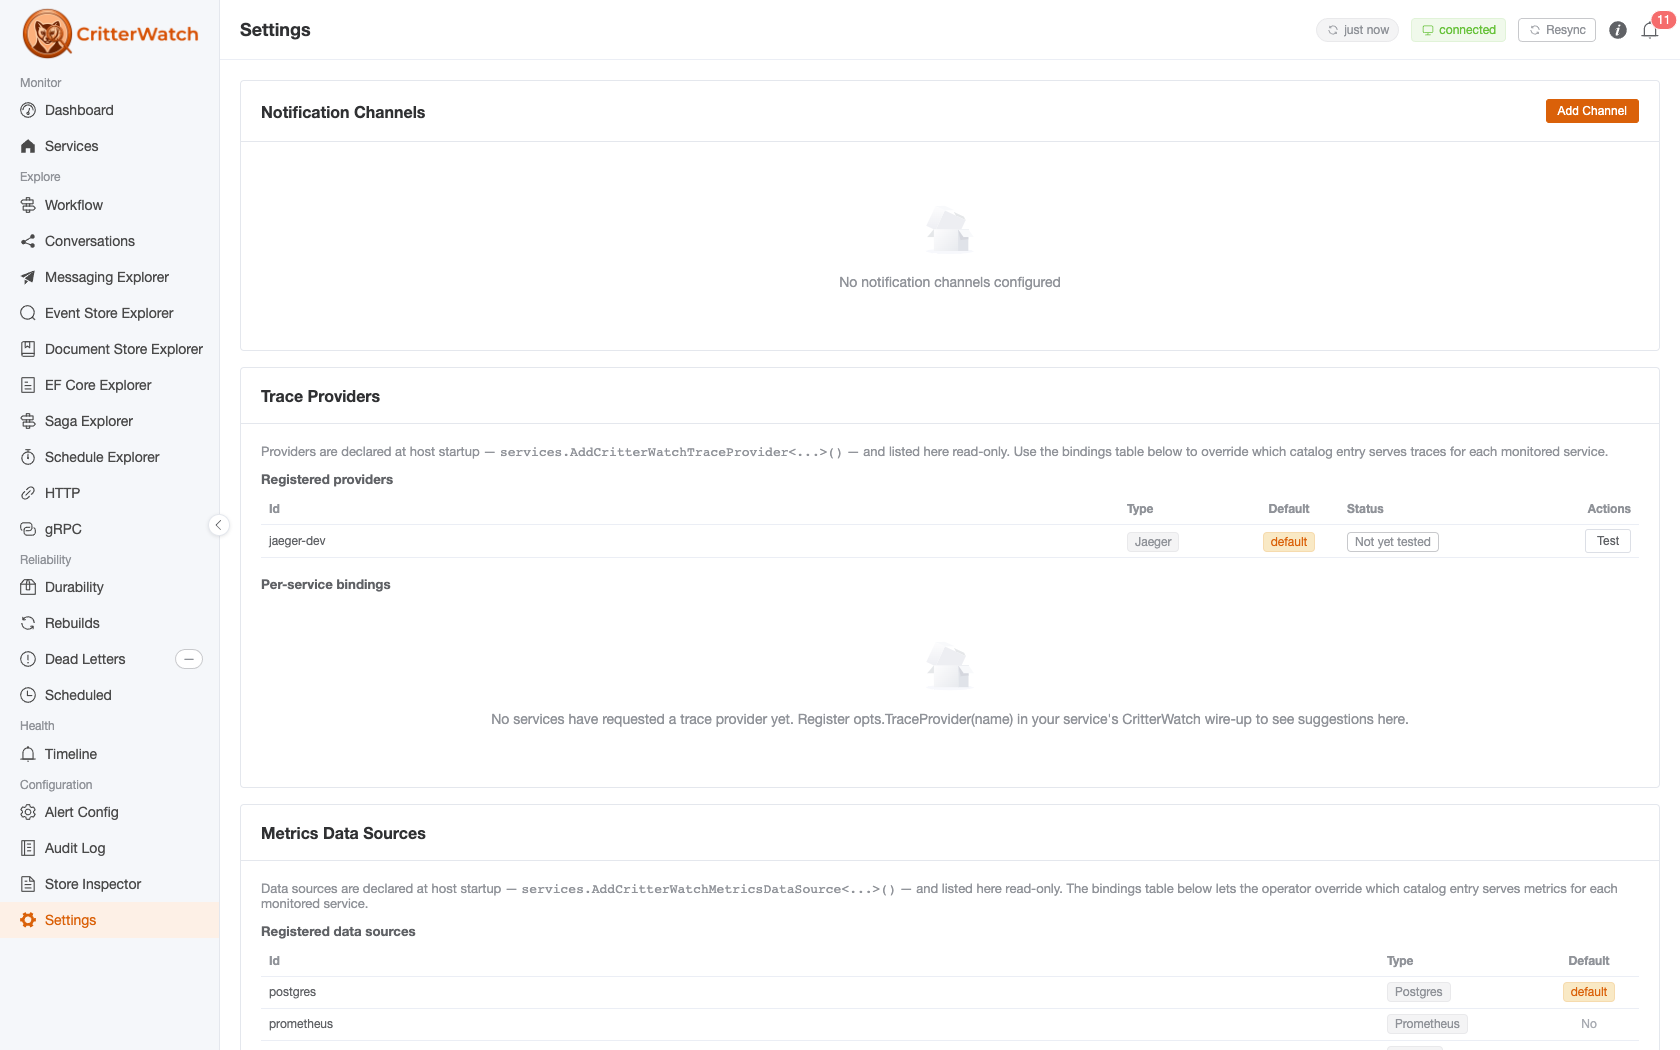
The page is laid out as a vertical stack of cards. Each card owns one setting area and has its own Save semantics; nothing on this page mutates a monitored service.
Auto-Refresh Intervals
Notification Channels
Trace Providers
Metrics Data Sources
License Info
Connection Settings
Data Retention
Auto-Refresh Intervals
The polling cadence for views that aren't covered by SignalR push (the Settings page itself, license info, audit log when auto-refresh is on, etc.).
| Field | Options |
|---|---|
| Global Default Interval | 5s · 10s · 30s · 60s |
The dashboard, services list, projections, listeners, durability, DLQ, and alerts pages do not poll — they live-update via SignalR. The interval here applies only to fallback polling.
Theme / dark mode: the dark-mode toggle is hidden for 1.0 (#421 — the dark theme isn't polished yet). The plumbing (localStorage
cw-dark-mode, global theme provider, highlight.js dual themes) is in place and the card returns when the theme ships.
Notification Channels
External delivery destinations for alerts. Each channel has a name, a type, a webhook URL, an enabled flag, and an alert-severity allowlist (which severities should fan out to this channel).
Channel types
| Type | Delivery |
|---|---|
| Slack | Slack Incoming Webhook URL |
| Discord | Discord Webhook URL |
| MS Teams | Microsoft Teams Incoming Webhook URL |
Email, PagerDuty, and generic webhook channels are planned but not currently implemented.
Per-channel actions
| Action | Effect |
|---|---|
| Test | Sends a synthetic alert through the channel. Result (Sent / error) appears below the row. |
| Edit | Opens the channel form for editing |
| Delete | Removes the channel (no confirmation popconfirm — the side effect is recoverable) |
| Add Channel (header) | Opens the channel form for a new channel |
The channel form takes the name, type, webhook URL (rendered as a password field — webhook URLs are secrets), enabled toggle, and a checkbox group of alert severities (critical / warning / info). Only severities in the allowlist trigger a delivery.
Trace Providers
External OpenTelemetry trace stores that CritterWatch queries when surfacing trace data on per-instance saga replay, handler-source-code views, and the Topology page. Nothing is stored locally — every render fetches.
Provider types
| Type | Status |
|---|---|
| Jaeger | Available now |
| Datadog | Available now |
| AppInsights | Available now — see Application Insights Tracing |
Multiple instances of the same type are supported (e.g. one Jaeger for dev, one for prod). Each provider has a stable runtime id used as the foreign key for per-service bindings.
How the catalog gets populated
Providers are declared at host startup through DI, not from the UI. The Settings page surfaces what's wired up; it cannot add or edit a provider on its own.
services.AddCritterWatchTraceProvider<JaegerTraceProvider, JaegerTraceProviderOptions>(
    "jaeger-dev",
    opts => opts.BaseUrl = "http://localhost:16686");

services.AddCritterWatchTraceProvider<DataDogTraceProvider, DataDogTraceProviderOptions>(
    "datadog",
    opts =>
    {
        opts.ApiKey = configuration["Datadog:ApiKey"]!;
        opts.AppKey = configuration["Datadog:AppKey"]!;
        opts.Site = "us1";
    });

services.SetDefaultCritterWatchTraceProvider("jaeger-dev");
This pattern moves endpoint URLs + credentials into strongly-typed options classes that bind from configuration / secret stores — the operator UI never sees the secrets. To add or remove a provider, edit the host startup and redeploy; the Settings page picks up the change on next load.
Registered providers (read-only)
| Column | Meaning |
|---|---|
| Id | Stable runtime id (e.g. jaeger-dev) |
| Type | Provider type (Jaeger, Datadog, …) |
| Default | "default" tag if this provider serves services without an explicit binding |
| Status | One-shot reachability probe — Reachable, Unreachable, Not yet tested |
The Test button per row hits POST /providers/{id}/health and updates the status in place.
Per-service bindings
The bindings table below the catalog is the routing layer — one row per monitored service that has either pushed a preferred provider (via the Wolverine.CritterWatch push API on the service side) or been overridden by the operator from this page.
| Column | Meaning |
|---|---|
| Service | Service id (matches what shows up on the Services page) |
| Pushed | The provider id the service declared in its CritterWatch wire-up; — if the service has never declared one |
| Active | Dropdown of registered providers — what CritterWatch actually uses for this service |
| Status | Single chip rolling up the four cases below |
| Actions | "Use pushed value" button — only visible when the row is overridden |
Status chips
| Chip | Colour | When |
|---|---|---|
| Matches request | green | Active provider == pushed provider; the operator has not overridden |
| Overridden by operator | amber | Active provider ≠ pushed provider; tooltip shows both ids |
| Provider not registered | red | Active provider id is not in the DI catalog; either the service is asking for a provider that nobody registered, or the operator picked one then removed the registration |
| No binding | grey | No provider id on the row (rare — only happens on bindings whose id was blanked out manually) |
Operator override flow
To route a service's traces to a different provider than the one it declared:
- Pick the new provider from the Active dropdown —
PUT /bindings/{serviceId}fires immediately, no save button. - The chip flips to amber "Overridden by operator". The dropdown stays editable so further changes overwrite the active value.
- To clear the override, click Use pushed value —
DELETE /bindings/{serviceId}resetsActive = Pushed. If the service has never pushed (row was operator-only), the entire row disappears.
The service-side push value is preserved across operator edits, so a service redeploying and re-declaring its preferred provider does not clobber the operator's pick.
The same Active dropdown is available on each service's Overview tab (Services → pick service → Overview → Trace provider). The Settings page is the cross-service view; the per-service tab is the single-service view. Either one writes to the same backend.
Metrics Data Sources
Metrics-data-source bindings mirror the trace-provider section: the catalog is declarative at host startup, and the Settings page surfaces a read-only listing plus a mutable per-service routing table.
Source types
| Type | Status |
|---|---|
| PostgreSQL | Built-in (always available) |
| Prometheus | Available now |
| VictoriaMetrics | Available now |
| Datadog | Available now |
| AppInsights | Available now — see Application Insights Metrics |
The built-in PostgreSQL source has a real storage cost under load
The default source persists one MetricsSample row per (service, message type, destination, tenant, minute) in the console's own database — a production fleet measured ~1 GB/hour from that table alone. The same multiplication drives the console's telemetry ingest volume: the samples arrive inside each service's ServiceUpdates batches, scaling with message types × destinations × tenants, and on high-tenant fleets they are the dominant share of what the console has to ingest at all. For any system with meaningful throughput, switch the service to WolverineMetricsMode.SystemDiagnosticsMeter — which stops the samples being produced and published at the source — and bind it to an external source (Prometheus, VictoriaMetrics, Datadog, Application Insights) here instead. See Metrics storage and sizing for the numbers and the knobs, and Use an external metrics stack under load for the recommended posture.
The PostgreSQL source is registered automatically by AddCritterWatchServices — services with no binding and no operator-declared default land on it. Additional sources are declared in host startup the same way trace providers are:
services.AddCritterWatchMetricsDataSource<PrometheusMetricsDataSource, PrometheusMetricsDataSourceOptions>(
    "prometheus",
    opts => opts.BaseUrl = "http://prometheus:9090");

services.SetDefaultCritterWatchMetricsDataSource("prometheus");
Registered data sources (read-only)
| Column | Meaning |
|---|---|
| Id | Stable runtime id |
| Type | Source type discriminator |
| Default | "default" tag if this source serves services without an explicit binding |
Per-service bindings
Same shape as the trace bindings table:
| Column | Meaning |
|---|---|
| Service | Service id |
| Pushed | The data-source id the service declared, or — |
| Active | Dropdown of registered data sources |
| Status | One of the four chips (same semantics as trace bindings: match / overridden / not registered / no binding) |
| Actions | "Use pushed value" reset, visible on overrides only |
Status chip rules and operator override flow are identical to trace providers — see above. The wire endpoints are GET/PUT/DELETE /api/critterwatch/metrics/data-source-bindings/{serviceId}.
License Info
Read-only. Pulled from GET /api/critterwatch/license.
| Field | Meaning |
|---|---|
| Tier | Open · Professional · Enterprise — colour-coded |
| Organization | License-bearing organization |
| Expires | Expiry date; "EXPIRED" tag in red if past due |
| Max Services | Cap on monitored services; "Unlimited" if effectively uncapped |
Below the descriptions block, a Feature Availability table lists every gated feature with a Yes / No tag derived from the license tier. The table reflects exactly what the running BFF will let you do.
If license info is unavailable (no license endpoint, network error), the card renders an empty state.
Connection Settings
Tunables for the SignalR connection between the BFF and the monitored services.
| Field | Range | Default |
|---|---|---|
| Reconnection Interval (s) | 1–60 | 5 |
| Connection Timeout (s) | 5–120 | 30 |
| Auto-Reconnect | toggle | on |
Lower reconnection intervals make CritterWatch recover faster from blips at the cost of more reconnect chatter; the defaults are fine for most deploys.
There is also a global "Operations Enabled" flag (set elsewhere in deploy config or via Aspire host) that switches CritterWatch into a read-only mode. When disabled, every action button on a service detail page renders disabled with a hover tooltip explaining why. This is the recommended way to lock the production console down during a freeze.
Data Retention
How long CritterWatch keeps its own bookkeeping data.
This card is read-only (#1013). It reports the effective values the pruners actually run with — the defaults overlaid with whatever the host's appsettings supplies — together with the configuration section each one binds from, so "where do I change this" has an answer. It is deliberately not editable: runtime retention edits interact with partitioning and with the pruners' batching, and would have to travel the SignalR command path. Change them in the console host's configuration and restart.
| Group | Binds from | Notable values |
|---|---|---|
| Timeline | CritterWatch:Timeline | retention period (default 30 days), prune interval, per-service row cap (off by default) |
| Metrics | CritterWatch:Metrics | sample retention period, hot window, bucket width, per-tenant sample ceiling |
| Conversations | max stored hops | |
| Capabilities | CritterWatch:Capabilities | history versions kept per service |
There is no audit-log retention
AuditLogEntry has no pruner and no retention setting — audit entries are kept indefinitely. An earlier revision of this page listed an "Audit Log Retention (days)" field; it has never existed.
Roadmap
Currently planned settings additions:
- OAuth / SSO — single-sign-on for the CritterWatch console
- Per-environment colour-banding — visual differentiation between dev / staging / prod CritterWatch instances
- Webhook channel — generic webhook delivery for alerts
- Backup + restore — export/import of CritterWatch's own configuration (thresholds, channels, providers) for environment promotion